To measure the user experience of Deakin Library Search, I implemented a Happiness Tracking Survey (HaTS). I adapted HaTS: Large-scale In-product Measurement of User Attitudes & Experiences with Happiness Tracking Surveys that Google deployed in products like Google Drive. I set out to “collect attitudinal data at a large scale directly in the product and over time”. As well as collecting data, happiness tracking allowed analysis to inform product decisions and measure progress towards product goals. In library discovery systems and other complex systems, there are many decisions to make to optimise the user experience.
Adapting the questionnaire
Question 1
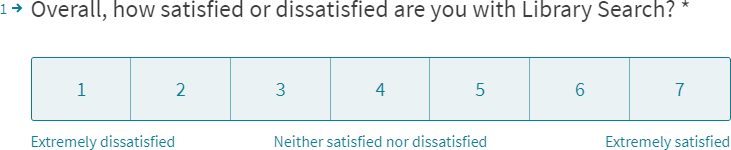
Satisfaction is measured through the question “Overall, how satisfied or dissatisfied are you with [product]?”
(Müller & Sedley, 2014)
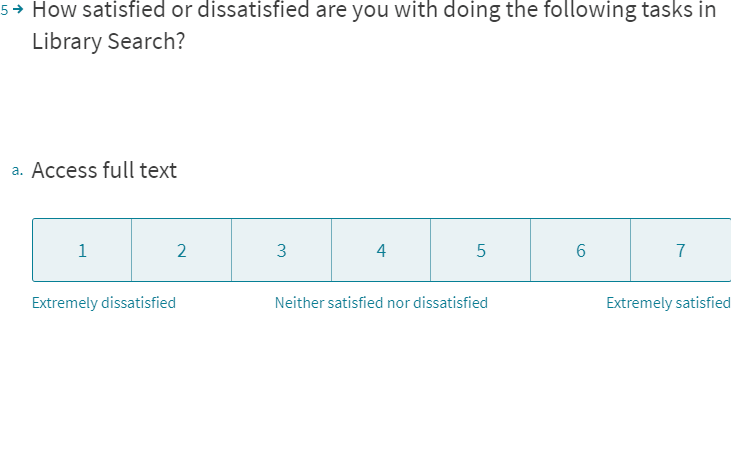
For the [product] name we used Library Search. As Müller and Sedley recommend, I maintained the neutral wording of the question text, and used a 7-point scale “to optimize validity and reliability, while minimizing the respondents’ efforts”. However, the survey tool I chose doesn’t allow labelling every point on an opinion scale, only the mid-point and the polar extremes. It also numbers each point on an opinion scale. I accepted these differences in how the authors constructed their response scale.
Other best practices adhered to in my implementation include:
- minimizing order bias by displaying scale items horizontally and with equal spacing
- minimizing the effect of satisficing by labelling the midpoint “Neither satisfied nor dissatisfied” (instead of “Neutral”)
- allowing for a more natural mapping of how respondents interpret opposite constructs by listing the negative extreme first
As in the authors’ case study, the satisfaction question is the only mandatory question. This ensures responses meet the primary objective: to track changes in users’ attitudes and associate those shifts with changes in the product.
Likely to recommend question—not applicable
Where there are competitors and alternatives, it may make sense for Google to ask, “How likely are you to recommend [product] to a friend or colleague?” However, it is redundant to ask a Net Promoter Score question in the context of library discovery system users.
Open-ended questions gather qualitative data
To gather qualitative data about users’ experiences with a given product, HaTS also includes two open-ended questions.
(Müller & Sedley, 2014)
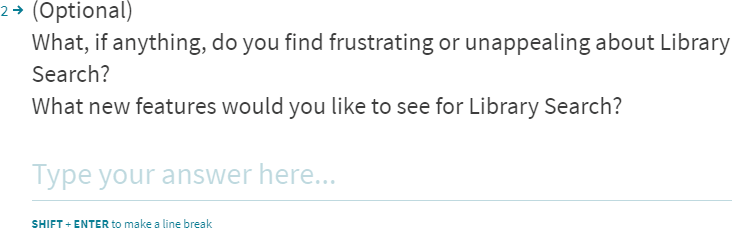
Müller and Sedley found “that asking about experienced frustrations and needed new capabilities in the same question increased the response quantity … and quality … and minimized the analysis effort as compared to using two separate questions”.
In an effort towards plain language, instead of capabilities, my question used the word features.
Also, rather than a tall text box, this survey tool only shows one line at a time. The SHIFT + ENTER instruction to make a line break is not intuitive. These survey design issues may have resulted in shorter responses than a large multi-line text box.
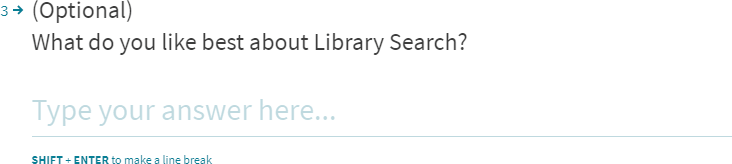
Adding “(Optional)” in the beginning of the question maintains the number of responses to these questions, and produces increased response quality.
The survey presents the question of frustrations first. Then it asks about areas of appreciation. This order helps identify opportunities.
Satisfaction with specific tasks
HaTS also assesses different components of the user experience, in particular, … satisfaction with product-specific tasks.”
(Müller & Sedley, 2014)
To ensure reliable satisfaction scoring, HaTS asks respondents to first select tasks they have attempted over the last month. Randomising the order of tasks avoids response order effects.

Using logic flows, only selected tasks appear in the subsequent satisfaction scoring questions. The survey tool I chose doesn’t have a conditional grid matrix to score several tasks at once. Instead, I designed the survey to present tasks one at a time. The advantage of this is it avoids overwhelming respondents.
Respondent characteristics—not included
HaTS can be configured to ask users “to self-report some of their characteristics in the context of using the product being measured.” For example, “In the last month, how many days have you used [product]?” Rather than directly asking respondents about their product usage, “it is preferred to pipe data directly into the survey database.” However, such data is lacking from products that don’t require authentication. At the time of implementation, using Deakin Library Search did not require authentication. Besides, this was my first time collecting masses of data on arguably the most important tool in a digital library. Layering on user data felt overwhelming and overkill for an academic library.
Intercept survey tool
The tool I chose for my survey was Typeform. Unlike its competitors, Typeform has a more conversational feel, has easy-to-create logic jumps, and works great on every device.
However, while Typeform works great on mobile devices, configuring the invitation to display on the mobile view of Library Search proved impossible.
Invitation on the search results page
Working with the vendor, I added custom HTML, CSS, and JavaScript to make the invitation appear in a banner at the top of search engine results pages.
![“Help us improve [product] Take our survey!” is the invitation banner to our happiness tracking survey.](https://vfowler.com/wp-content/uploads/2019/08/invitation-link-at-top-of-search-results.png)
A browser cookie records whether someone takes the survey or hides the invitation. This means they won’t see another invitation for 12 weeks in the same browser and device. This is the best we could do to avoid over-sampling issues and effects of survey fatigue. Users noticed repeat invitations when using public on-campus computers.
A future implementation scheduled authentication for Library Search, Single Sign On (SSO). Requiring authentication could also enable random sampling from the entire user base.
Take our survey!
I designed the Typeform questionnaire to launch in a pop-up modal. A modal maintains context. The product for evaluation remains in the background.
Automating survey data storage
Then, I set up a Typeform to Airtable Integration (via Zapier) to automate pushing survey data into an Airtable database. In August 2017, users submitted 237 responses, the first month of operation. Unfortunately, this exceeded the Zapier free plan limit of 100 automation tasks per month.
After the initial peak in August, the frequency of responses per month drops off quickly. The main reason for fewer responses in subsequent months is that people who had either taken the survey or dismissed the invitation would not see another invitation for 12 weeks. The academic calendar also causes seasonal variations in usage. Deakin University trimester 2 exams end by late October. Based on these factors, I expect the next surge of responses to coincide with early trimester 1 in 2018. I recommend automating survey data storage. For instance, you can now send data from a Typeform PRO account directly to Airtable.
Satisfaction scale data
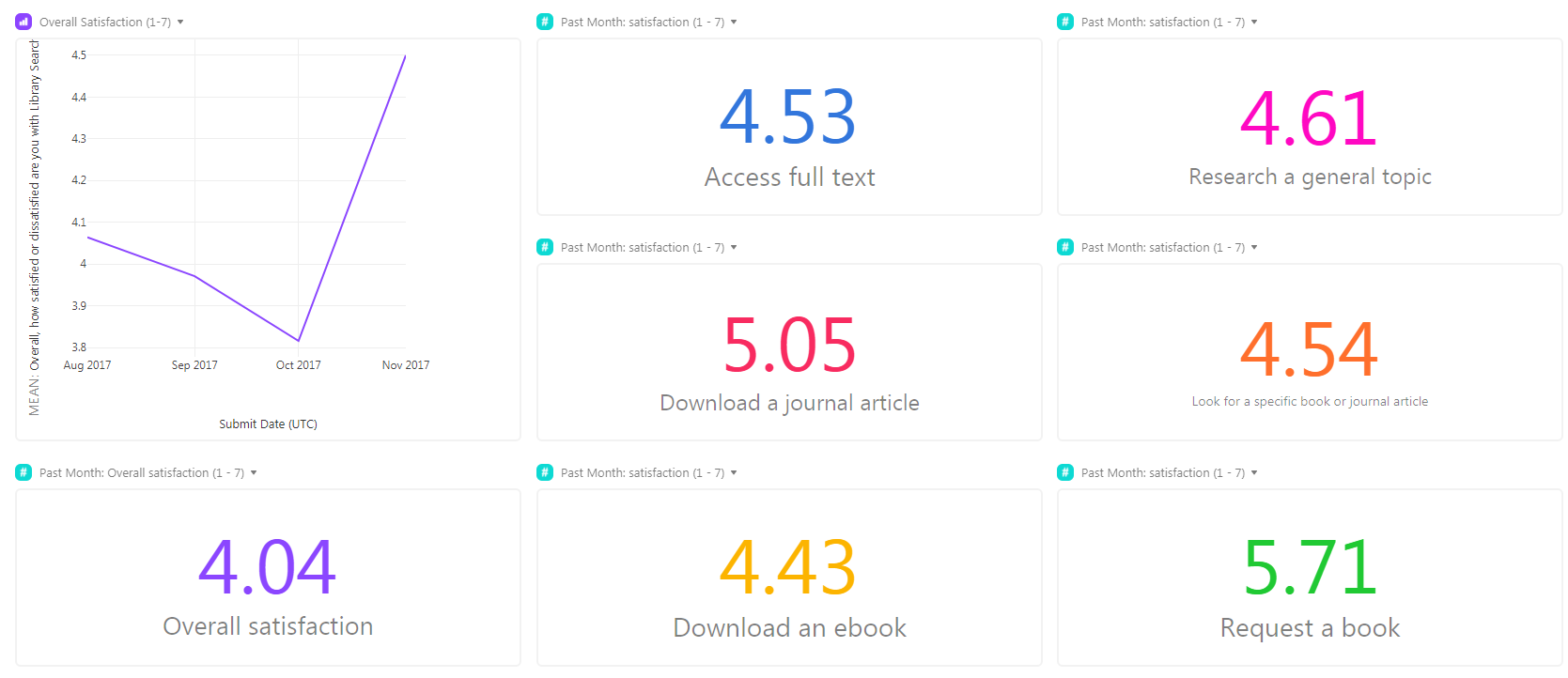
Over the four months, I gathered data to establish baselines for satisfaction overall and with product-specific tasks. The satisfaction scales from extremely dissatisfied to extremely satisfied, numerically coded from 1 to 7.
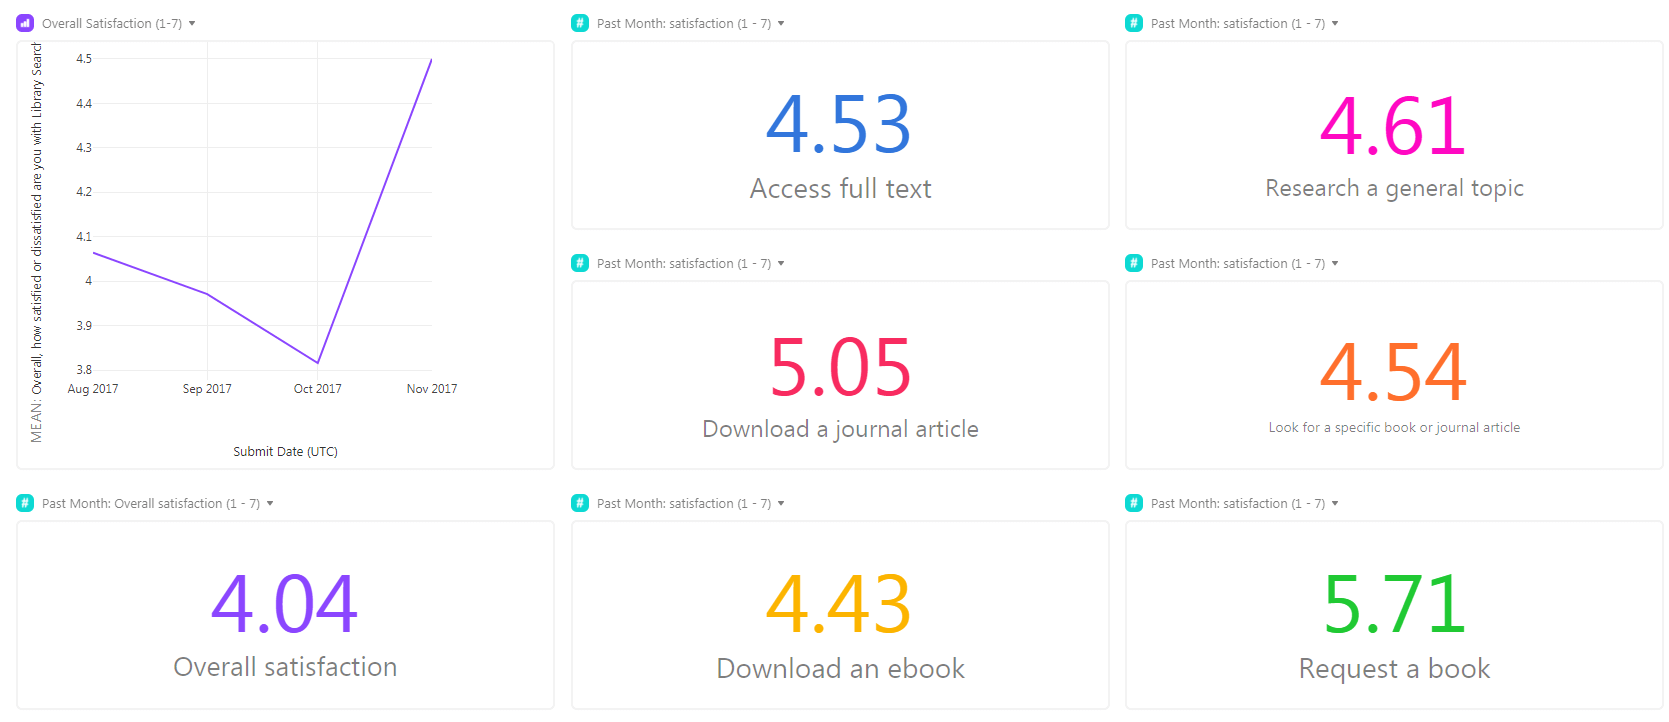
Overall satisfaction scored an average of just over four, the mid-point of the scale. The general sentiment towards Library Search is neither satisfied nor dissatisfied. Analysing qualitative responses might hint at where there is room for improvement.
Monitoring satisfaction trends with product-specific tasks is critical to inform product decisions. The following tasks and their baseline satisfaction are:
| Task | Satisfaction score 1 to 7 |
|---|---|
| access full text | 4.5 |
| research a general topic | 4.6 |
| download a journal article | 5.1 |
| look for a specific book or journal article | 4.5 |
| download an ebook | 4.4 |
| request a book | 5.7 |
Analysing qualitative feedback
Digging into responses to what people find frustrating has been most fruitful. Collaborating with Digital Library & Repositories team colleagues, I clustered similar pain points to build themes. Analysis quickly led to actionable insights such as:
- session expires before activities are complete
- book reviews (rather than books themselves) were dominating results
- confusing and overwhelming interface
Putting research into action
Working with the vendor and my research evidence, I addressed user frustrations. To resolve the annoying timeout issue, a session keeper was developed. Also, excluding book reviews by default was another new enhancement. This resolves the issue of reviews cluttering search results pages.
Want to start happiness tracking in your digital product?
Have you used intercept surveys for happiness tracking? Tell us about it.
Would you like to start happiness tracking and learn how to optimise user experiences of your digital product? Would a database template help? Leave a comment.

